The surprising transparency hidden inside the US oil and gas machine
A wealth of high-resolution data on oil and gas operations in the US is hiding in plain sight, but few outside of industry know how to navigate it.


Transparency is not a word that comes to mind when one thinks of the US oil and gas industry.
Its main product, oil, is almost a byword for secrecy.
Its leading companies excel at the dark arts of denial and diversion in high-stakes political wrangling.
And one of its latest coordinated lobbying efforts is an attempt to gut a powerful transparency mechanism set up by the European Union to limit the emissions of one of the most potent greenhouse gases.
Yet, what has surprised us, since taking various excursions into American oil and gas land over the last few years is just how wildly transparent some parts of the supply chain are.
While some initiatives — such as the EPA’s Greenhouse Gas Reporting Program — reflect more recent concern for the environment and climate, there is also a longer-standing legacy of transparency rooted in earlier waves of public concern about monopoly power, the preservation of hydrocarbon resources, and public safety.
These sources are sitting in plain sight. They are often overlooked, but they can be goldmines for journalists, campaigners, and watchdogs.
Why do these sources matter? There are many reasons, but these are three starters:
As the US federal government slows down and rolls back transparency rules around emissions, some of these data sources, particularly those from state regulators can fill in important gaps.
These datasets contain a wealth of geospatial information on pipelines as well as transactional data on movements of oil and gas through the system. This, combined with the data from satellites like Carbon Mapper’s Tanager could reveal leaks in supply routes linked to LNG export terminals.
They contain a wealth of facility-level data on venting and flaring which could be useful to check companies’ claims about how well they’re doing in reducing these polluting activities.
In this post, we introduce four of the most useful tools we’ve come across. In future posts, we’ll show how we’ve used them to expose hidden emissions, trace supply chains, and challenge the narratives coming from the oil and gas industry.
Texas Railroad Commission
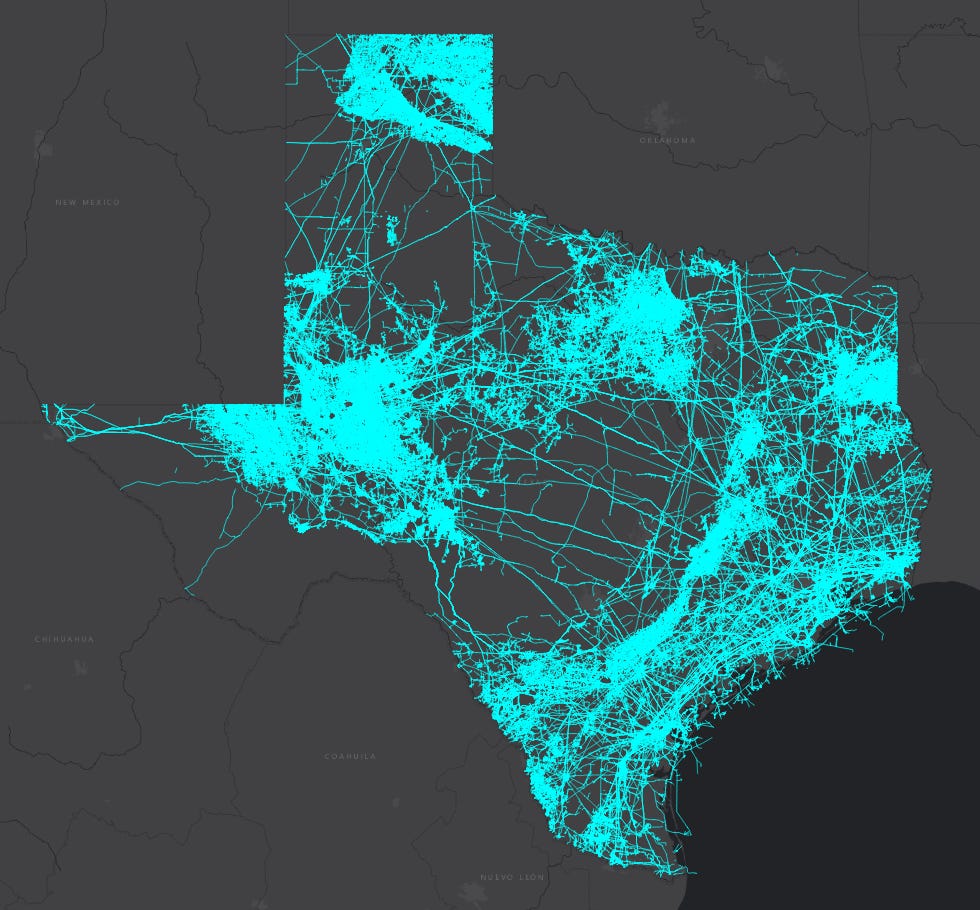
Texas is the hydrocarbon heart of the United States with a rich history of fossil fuel production going back to the end of the nineteenth century and the precipitating Texan oil boom of the early twentieth. Now it produces over 40% of the marketable oil and over 25% of the gas in the US. So it’s a good place to start.
Formed in 1891, the Texas Railroad Commission (RRC) was set up to regulate railways at a time when there was widespread concern around monopolistic practices and pricing extortion by railway operators. Three decades later, its role was expanded to include oil and gas. Today, the RRC publishes a dizzying array of data on Texas gas production and flows. There are bulk file download options and various query interfaces.
The RRC’s P-4 form lets you find which companies a well sends its oil and gas to, enabling you to re-construct chains of custody for oil and gas. The T-1 database lets you track receipts and deliveries for volumes of crude, although there is no equivalent for gas.
Form H-10 contains data on what is being injected into wells, potentially useful for those studying Enhanced Oil Recovery, the practice of injecting liquids and gases underground to force more oil out of depleted wells, which is currently the main use of captured CO2 in the United States.
Louisiana Department of Natural Resources
One of the major and growing sources of gas in the US is the Haynesville Basin which is primarily in Louisiana. Many of the LNG players are touting it as a ‘cleaner’ source of LNG feedgas than the Permian Basin in Texas. This has elevated interest in data on Louisiana production by watchdog groups like ourselves who want to try and test the claims being made by industry.
Louisiana makes its oil and gas data available through SONRIS, the Strategic Online Natural Resources Information System.
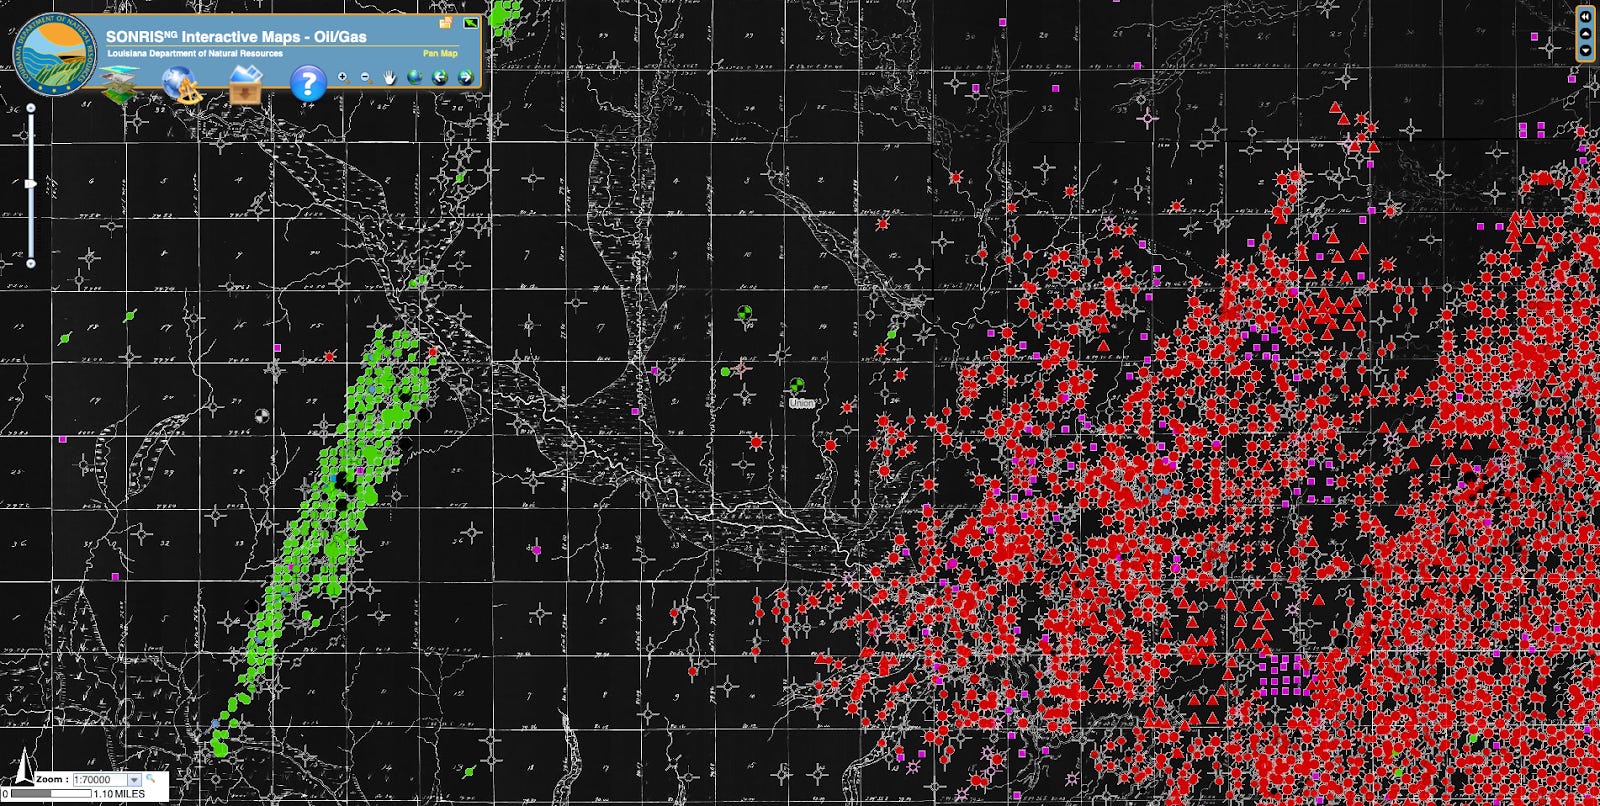
The starting point is the GIS Viewer tool, an interactive map which is only available to access via a US IP address (we use a VPN). This portal is mostly useful for investigating emissions from wells, as it includes the exact location of every oil and gas well in the state, including — for shale gas wells that are drilled horizontally — both the top and bottom hole. However, it lacks information on infrastructure: the pipelines, treatment plants and compressor stations that bring gas from the wellhead to customers.
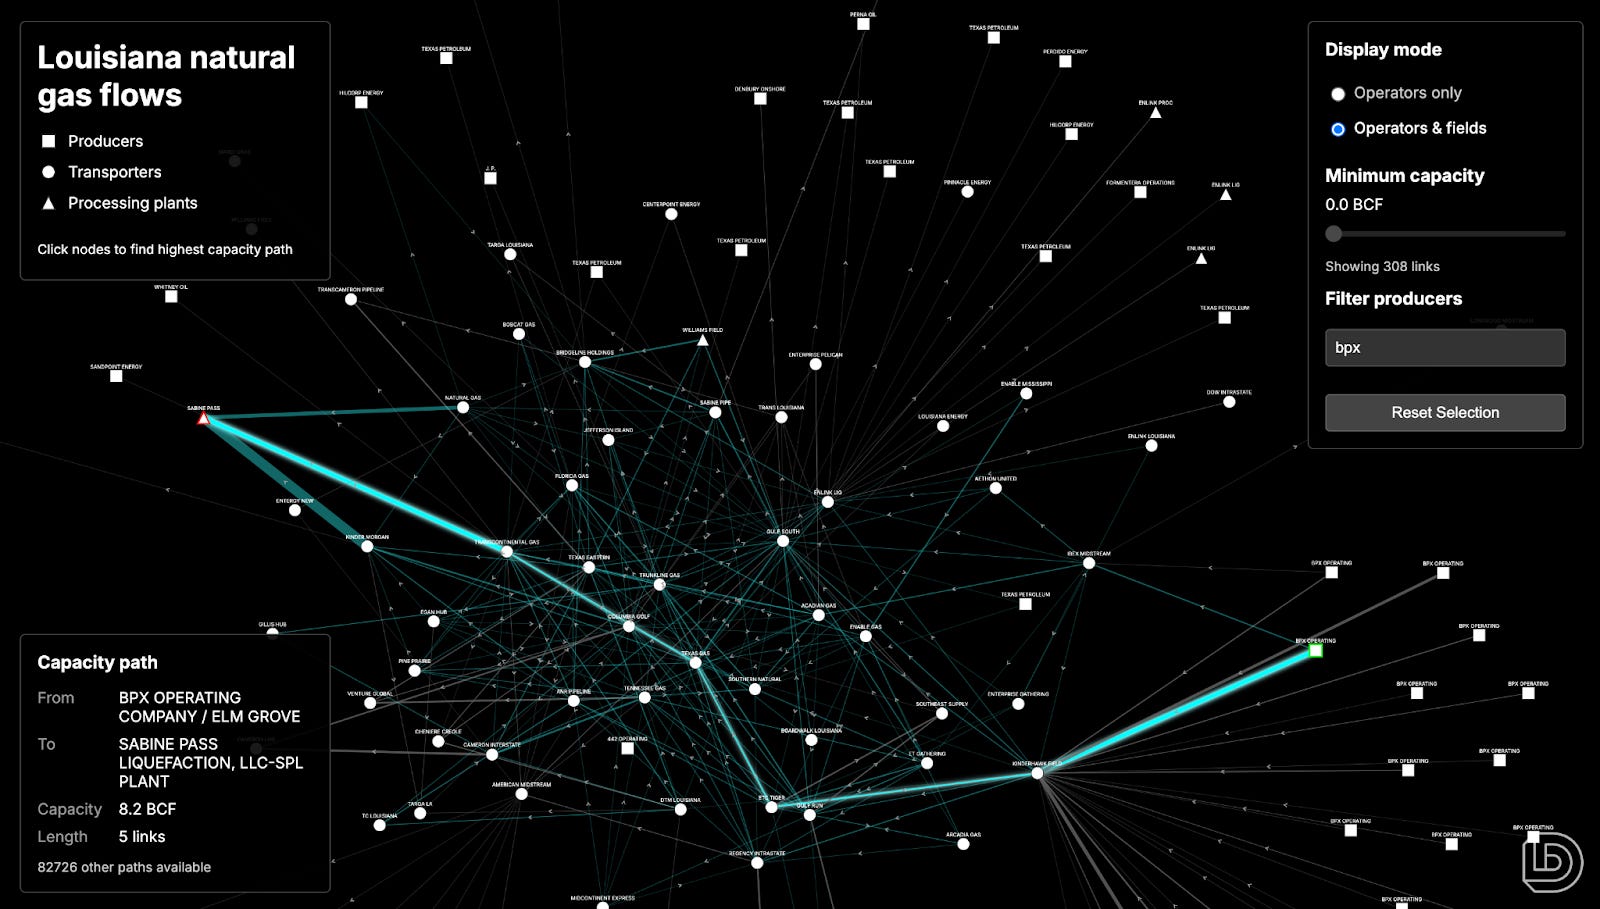
For a better sense of how gas moves within the state, we turn to the SONRIS Data Portal. Here, it’s possible to access compiled versions of various forms submitted to the regulator by gas producers and transporters, including the extremely useful Form R5T, ‘Natural Gas Transporter’s Monthly Report’, which shows transfers of gas between companies. To help us work with this data, we’ve written a scraper that downloads it all from SONRIS and visualises it as a network, allowing us to trace how gas flows — or at least, how it is able to flow — through the system.
Wyoming Oil and Gas Conservation Commission
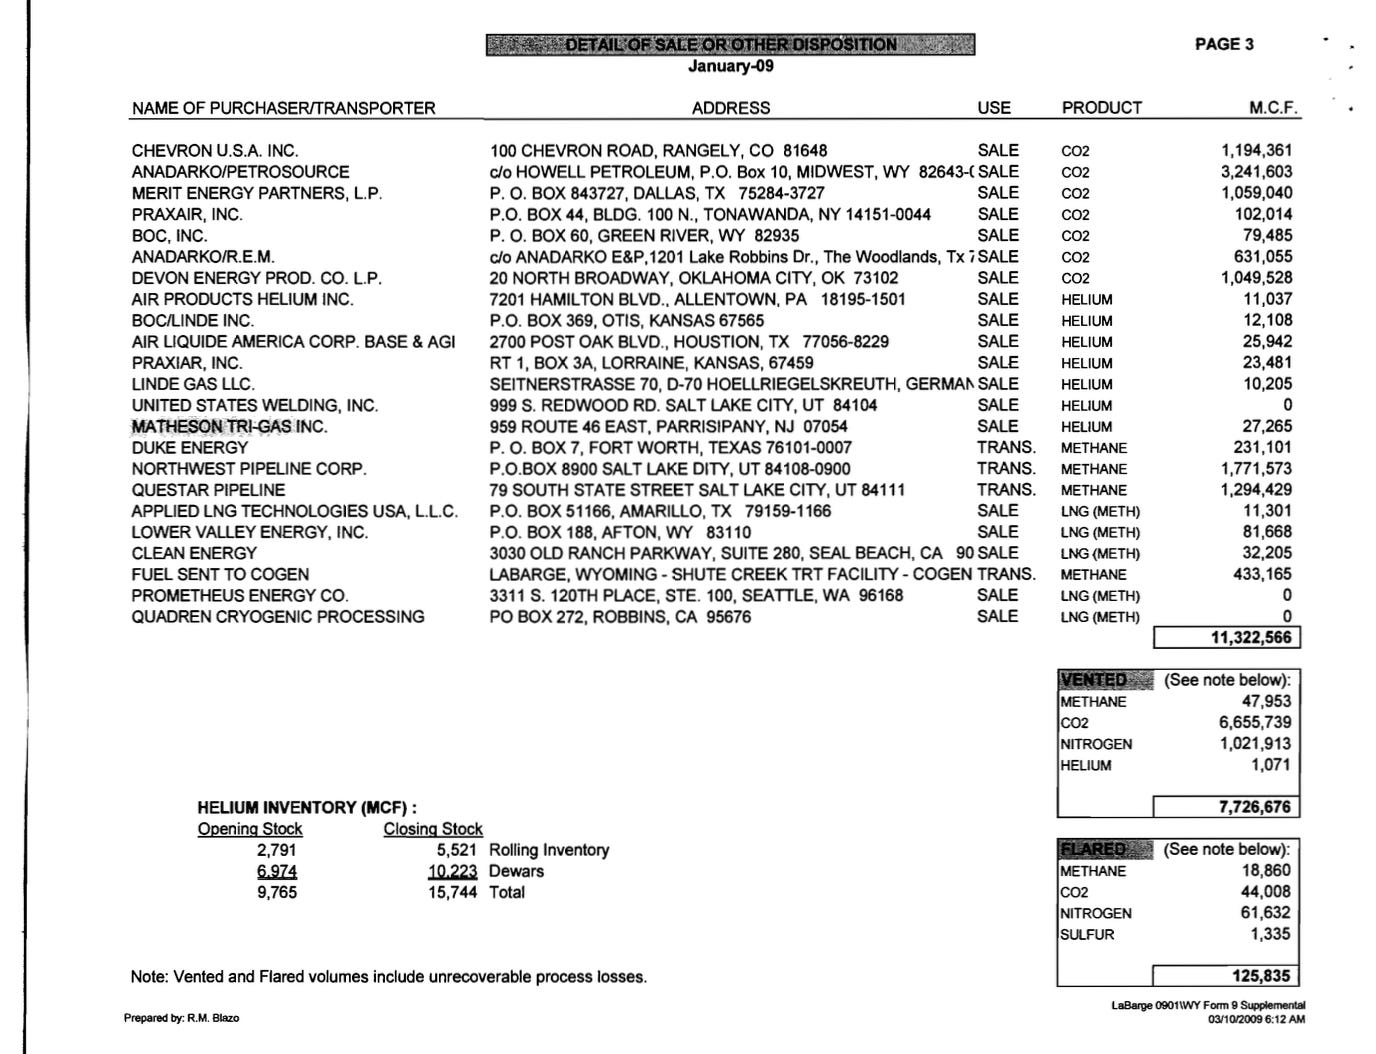
While not one of the major oil and gas producing states, the Wyoming Oil and Gas Conservation Commission is worth a mention. We found its Form 9 particularly useful for researching Exxon’s Shute Creek gas processing facility, one of the world’s largest carbon capture plants by nameplate capacity. Form 9 can tell you, for instance, how much methane a gas processing plant flared or vented, how much CO2 it stored and how much it sold to other players. The main data portal can be accessed here.
The federal level
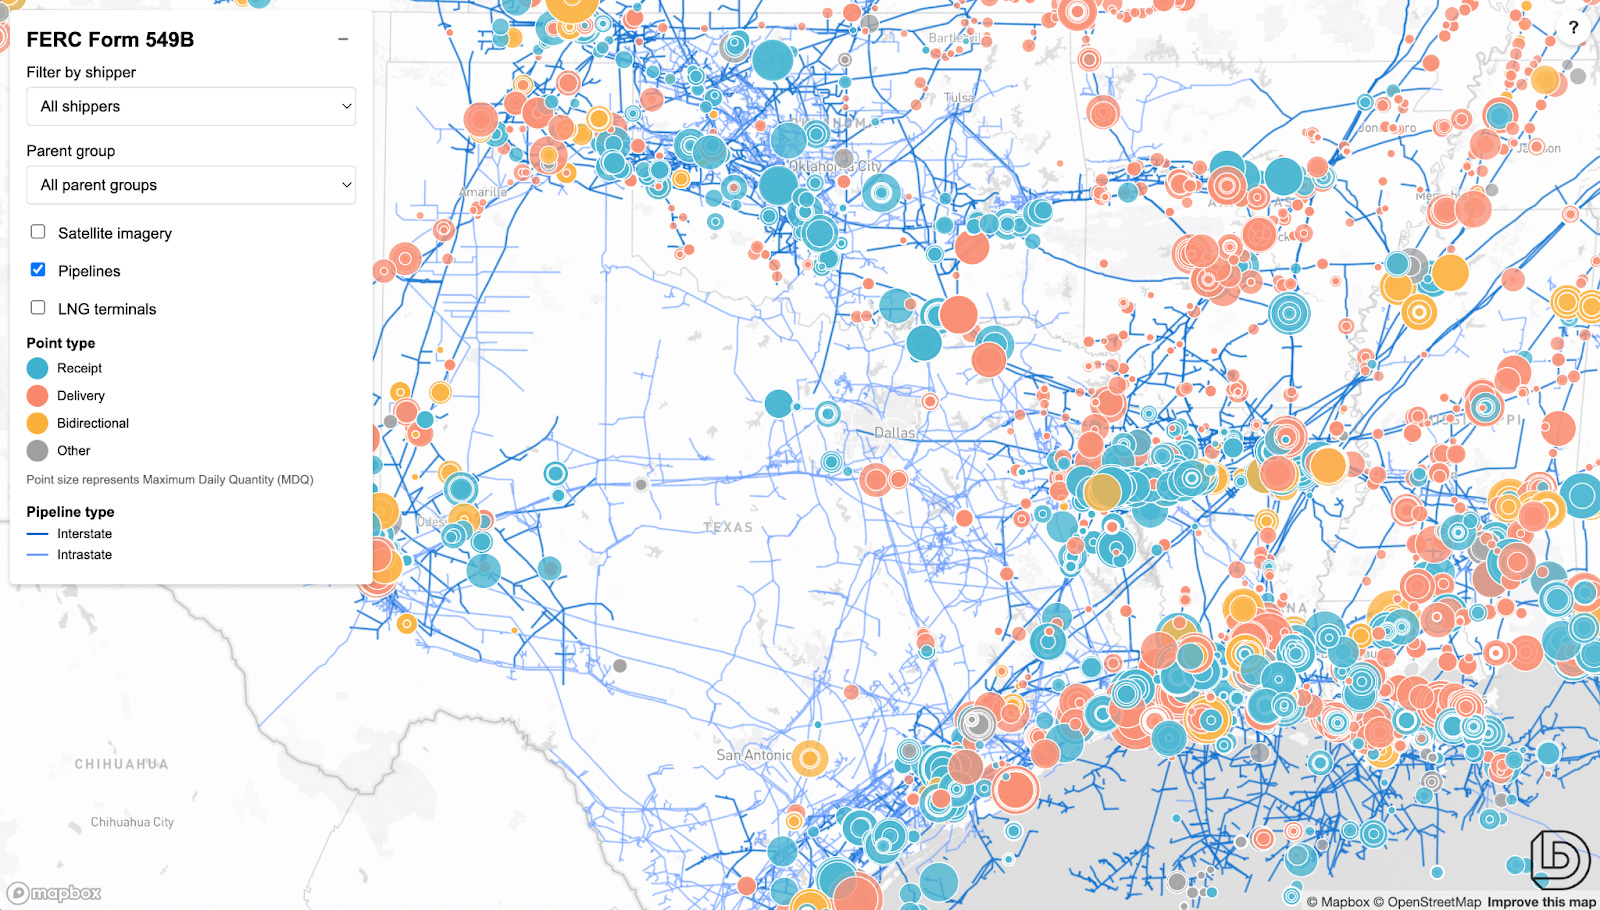
The profusion of US oil and gas data isn’t limited to the state level. Looking at the country as a whole, the Federal Energy Regulatory Commission (FERC) is a goldmine, providing a clear view into capacity booked by producers, consumers and transportation companies on interstate and intrastate pipelines. This data comes via two routes:
For the major interstate pipeline systems like Kinder Morgan’s NGPL, each pipeline has its own dedicated ‘electronic bulletin board’ (EBB) system which publishes information in a FERC-mandated format. Like the SONRIS GIS viewer, these often require a US IP address to access.
Our favourite section is the ‘Index of Customers’, where the operator lists all the companies with booked capacity on the system, including the volumes and the specific meter points at which they can either receive or inject gas. This information, submitted via Form 549B, is also collected centrally by FERC.For pipelines which remain within a single state — a category which includes key ‘takeway pipelines’ bringing gas from the Permian basin to LNG terminals on the Texas coast — reporting requirements are less strict, but we can still get useful information on capacity by turning to Form 549D.
As with the Louisiana data, the best way to work with this stuff is to visualise it. By matching the meter points listed in each operator’s FERC filings to a geospatial database of the US gas network that we have access to via the London Stock Exchange Group (LSEG), we can immediately start to see patterns in receipt and delivery, filter down to companies of interest, and even track flows of gas in near-real time using nominations data published on the EBBs.