Learning to love the Suez Canal
Two trade flows for the price of one!
When the Glory, a bulk carrier loaded with Ukrainian grain, ran aground in the Suez Canal earlier this month, minds naturally turned to Brenda from Bristol: “Not another one!”
Thankfully for the frankly knackered sinews of global trade, this didn’t turn into another Ever Given — the stranded ship was quickly re-floated by four tugs and traffic through the canal was on its way again. But the incident put the spotlight back on Suez and its vital role in connecting Europe with Asia.

When it was opened in 1869, the Suez Canal more than halved the journey time between the Arabian Sea and London, setting the stage for the emergence of ‘AngloArabia’, the double-sided (post-)colonial project that David Wearing explores so well in his 2018 book on the subject.
While the canal’s geopolitically strategic position has had a pretty serious impact on its overall ‘uptime’, slicing out this narrow channel between the Mediterranean and the Red Sea nevertheless completely reconfigured trade flows in the Old World, and the canal has arguably become even more important with the rise of China and India as manufacturing and industrial hubs.
This pivotal role means it’s particularly important for researchers tracking global trade flows — like us! — to have visibility on shipments through the Suez Canal.
Trade data generally comes in the form of imports or exports for individual countries. For example, access to data from the Russian customs service on the country’s exports has proved incredibly useful for tracking under-the-radar flows of oil and refined products since the imposition of Western sanctions following the full-scale invasion of Ukraine.

But what if you want to look at shipments from a country that keeps its export or import data under lock and key? As I’ve learned from conversations with my ex-colleague Ben, the ecosystem for trade data is… ad hoc. Different aggregators have different levels of coverage, and timely access to original feeds from customs offices or bills of lading relies on a patchwork of small-scale commercial and personal relationships in the source countries.
Within this complicated and multipolar system, the Suez Canal acts like a checkpoint — if you can get access to the data, you can see flows in both directions for any product, travelling between any and all countries.
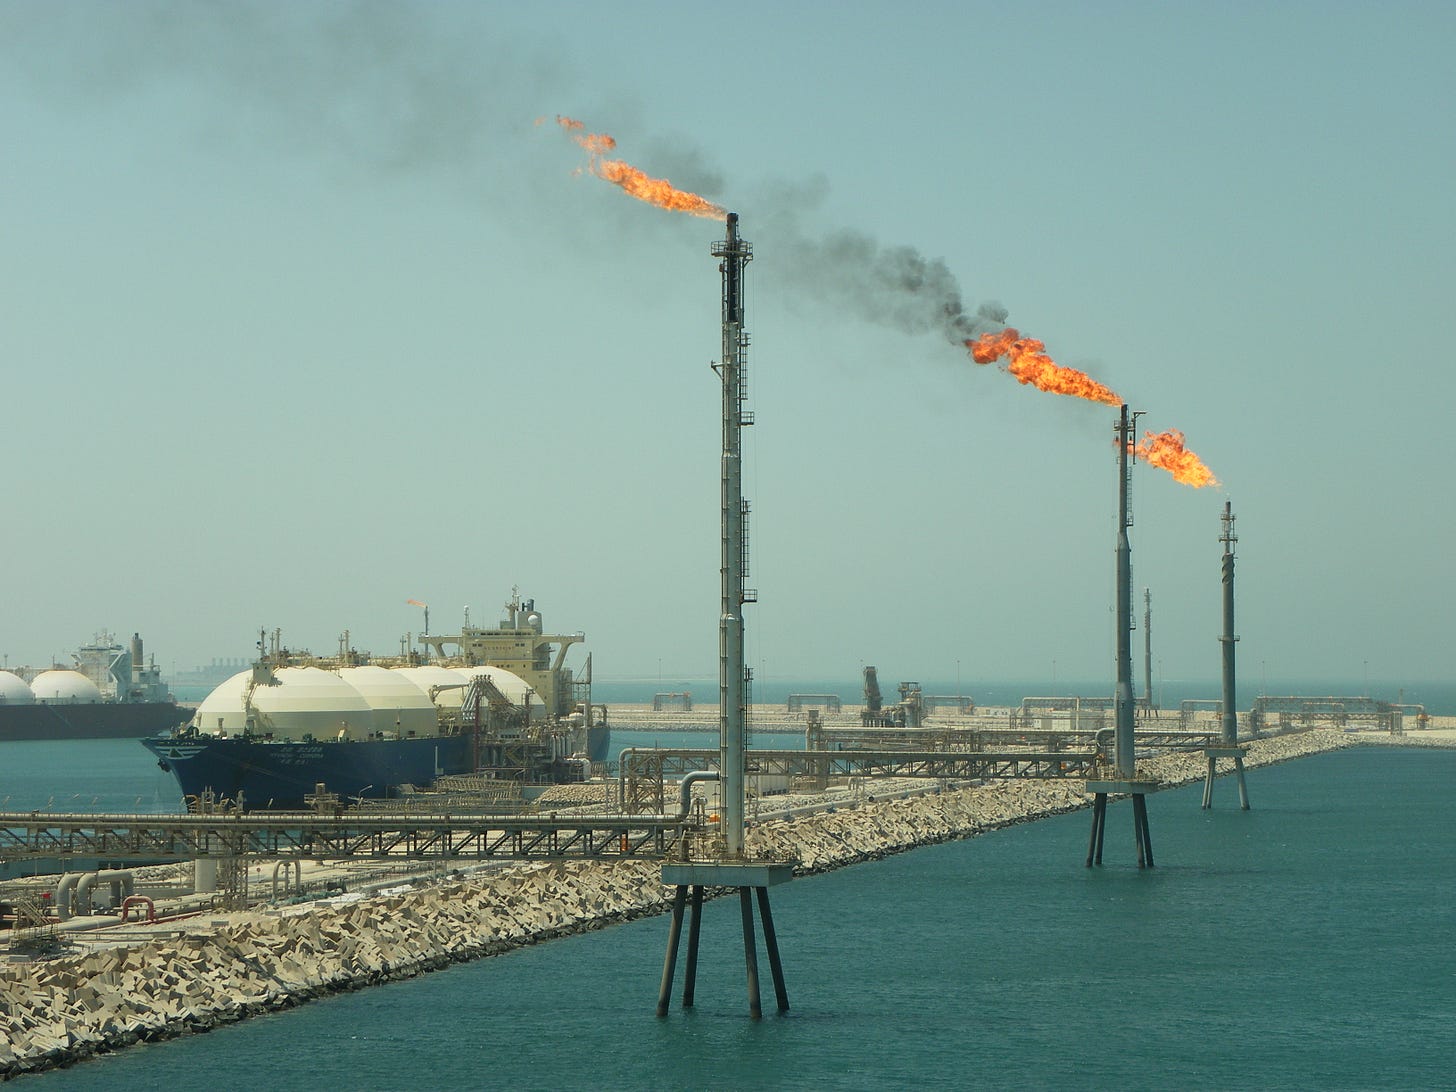
Let’s take helium — a commodity I’ve spent a lot of time getting my head around recently — as an example. Edison Research publish an excellent report on helium, including a model forecasting global supply/demand out to 2030. While it hasn’t been updated since mid-2021, the expected future share for Qatar in the global trade (mid-grey) is significant and set to expand, assuming that the Gulf state has some cash left over from the World Cup to build a fourth helium plant at Ras Laffan.

Where does the country’s helium — produced from its massive natural gas reserves — end up? We can get a high-level idea of volumes from official trade data published through UN Comtrade, whose user interface has recently been refreshed. But this won’t tell us anything about the actual buyers and sellers, how the cargo is transported, or even the dates on which it moved. We’re at a loss when it comes to direct trade data, too. Neither of the aggregators which we subscribe to carries export data for Qatar – and while we can get an idea from other countries’ import data, this too is limited.
Luckily, Suez has (part of) the answer. Digging in to the individual shipments data reveals a regular flow of liquid helium between Jeddah, Saudi Arabia’s largest port, and Rotterdam, the hub for containers delivered to north-west Europe. The gas is transported in special cryogenic ISO tanks and provided by a company called Pure Helium Gulf FZE, which Orbis lets us know is a subsidiary of Air Liquide, a French company which is one of the world’s largest industrial gas suppliers. Since the importer is also given as Air Liquide, and we know that the company has significant investments in Qatar, we can be fairly sure that we’re looking at Qatari helium here.
As a bonus, the Suez data includes the names of the ships that carried each cargo, so we can track their actual journeys. And as it happens, validation using another data source is a worthwhile exercise, because it helps us understand the underlying data better. Here are all movements by the Pusan C, a container ship recorded transiting the Suez Canal in December 2021, for the three months either side.
A closer look shows that the ship didn’t call at Jeddah on its way to Rotterdam from Singapore, as you might expect. In fact, it was last in the general area (King Abdullah Port, a new container port two hours’ drive north) in September 2021, on the way back from its previous voyage, before stopping off at several Australian ports and starting the whole journey all over again.
Shipping! It’s a funny old world. Two recommendations to help make sense of it all:
follow the CEO of Flexport, Ryan Petersen, on Twitter, and listen to his latest appearance on Odd Lots;
read Deep Sea and Foreign Going, an excellent 2013 book by the journalist Rose George, recounting her experience on board a massive Maersk container ship.


